At 250, sustaining America’s competitive edge
At 250, sustaining America’s competitive edge

https://www.mckinsey.com/mgi/our-research/at-250-sustaining-americas-competitive-edge?
By
America’s history of reinvention holds compelling lessons as the nation confronts a future of immense if uncertain opportunity
At a glance
- At 250 years old, the United States is the world’s most competitive economy. It generates 26 percent of global GDP and is home to 59 of the world’s top 100 firms. In the past several years, accelerating US productivity growth and announced foreign direct investment inflows have sharpened its edge over other advanced economies.
- It’s a new world. AI is unveiling an ever-expanding realm of possibilities, just as geopolitical contention is growing and fertility rates are falling. The United States is a global technology leader today and spends 27 percent of the world’s research and development dollars—but will that be enough to sustain its current 59 percent share of top firms?
- Some US historical competitive advantages are becoming liabilities. Current generations owe it to future ones to address deteriorating fiscal health, eroding infrastructure, declining educational achievement, fading manufacturing know-how, and sustained disparities in income and wealth.
- Safeguarding an economic edge requires evolving, as America has before. The United States has repeatedly adapted its economic model to meet, and then shape, new technologies and geopolitical realities. Since the country’s founding, American competitiveness has shifted but sustained across four historical chapters: agricultural, industrial, scientific, and digital. A new one is coming.
- A culture of innovation and natural abundance are abiding strengths on which to draw. By our count, Americans created or supported 76 of the 100 most important inventions since 1776, from steamboats to smartphones, from the electrical grid to generative AI. Over its history, the country has profited from twice as much agricultural land per capita as any other large economy, and it was largely self-sufficient in energy for 200 years, including since 2019. These are just a few examples of its resource wealth.
- We the people will write the coming chapter. Collective effort from American individuals, business, and government can ensure energy abundance, an infrastructure backbone, education that builds minds and skills to match new technology, and the financial strength to pay for it all. The prize is continued growth, national economic security, and economic opportunity for everyone.
Exhibit
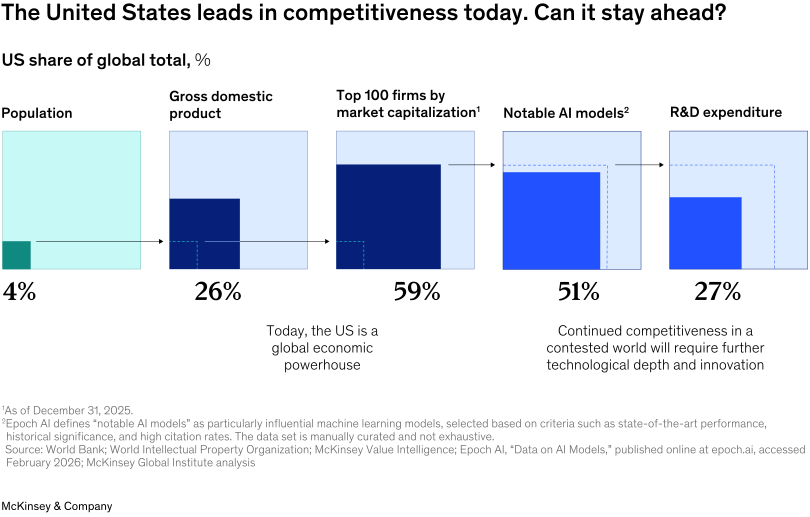
A row of five squares compares the United States’ share of global totals. The US has 4% of global population but a much larger share of global economic and innovation measures: 26% of GDP, 59% of the top 100 firms by market capitalization, 51% of notable AI models, and 27% of global R&D spending. The main message is that the US is “punching above its weight” in output, corporate value, and innovation, and sustaining the lead depends on continued technological depth and investment.

Listen to this episode of The McKinsey Podcast on what drives the US’s competitive edge—and what leaders need to do to maintain that edge in the AI era
Introduction
It began with a startling act of rebellion. In July 1776, delegates from 13 British colonies declared their independence, dissolved their bonds with England, threatened war, and pledged “our Lives, our Fortunes and our sacred Honor” to each other and their newly united states.
One delegate described the mood in the room as a “pensive, awful silence.” The new nation’s leaders harbored grave reservations. All were acutely aware of the potential consequences of their choice: ruin, prison, war, and death. At a remove of 250 years, it’s hard to conceive of the courage that the founders summoned as each walked to the desk and picked up the quill.
Their courage paid off. Over two and a half centuries, the country has transformed from a collection of agrarian colonies into the world’s largest and most influential economy. American firms shape global markets, accounting for more than half of the world’s market capitalization. US innovation ecosystems define the frontier of science and technology; 76 of the 100 most influential innovations of the past 250 years came at least in part from American minds and hands. Average living standards have exceeded those of any other large nation for the past 100 years, even as affordability remains an issue. By these and many other measures, the United States today is the most economically competitive country in the world.
America’s enduring economic edge was never inevitable. The United States, like most every nation, has been shaped by extraordinary difficulties—wars, recessions, depressions, and pandemics. But America has consistently come through in ways that others have not. In large measure, that’s thanks to two foundations of American economic competitiveness that it has relied on again and again: a culture of ambition and individual achievement, and a bountiful natural endowment.

Enterprise AI: The decision you can’t delegate
May 21, 2026, 11:30 am - 12:15 pm EDT / 5:30 - 6:15 pm CET
Join McKinsey partners for a discussion on the decisions that belong on the CEO's agenda: How do you move from productivity to durable competitive advantage? What does it mean to lead a workforce that is one-third human and two-thirds agents? And why is AI architecture now your single most consequential strategic decision?
Through every chapter of the past 250 years, the United States has harnessed these foundations, not in a fixed economic model but through flexible institutions that have made the next adaptation possible. And it has done so collectively. “We the people”—farmers in the fields, tinkerers in backyard workshops, teachers in schoolrooms, machinists at forges, seamstresses at machines, developers pulling all-nighters to invent world-changing code—have built an American economic powerhouse.
Today, the United States possesses immense economic strengths anchored in its twin foundations. But if history is any guide, these will carry the country only so far. The challenges are clear and present: a mounting national debt, eroding infrastructure, slipping test scores, fading manufacturing know-how, and sustained disparities in income and wealth. The question America confronts today is not how to celebrate its past but whether it can once again find a new alignment of its resources, ambitions, institutions, and policies to secure competitiveness in the next chapter of its story.
Much is at stake: individuals’ access to productive employment and affordable essential goods, businesses’ ability to scale and take risks, and government’s capacity to raise funds and ensure national economic security.
This report examines the arc of US competitiveness, past, present, and future. America’s history of reinvention holds compelling lessons as the nation confronts a future of immense if uncertain opportunity.
Chapter 1.
At 250, the United States is the world’s most competitive economy
Over the course of 250 years, the United States has transformed from a small agrarian economy to the world’s leading economic power, a position it has enjoyed for more than a century. Today it has the highest income of any populous country (Exhibit 1).1
American firms have undergone a spectacular evolution, from small textile mills in New England to world-leading industrial powerhouses to platform technology companies that shape everyday lives around the globe. American innovation, once a matter of adapting tools developed elsewhere to local settings, has gone on to set the global technology frontier. Over time, rising productivity has steadily lifted household living standards and created economic opportunities for millions.
Exhibit 1
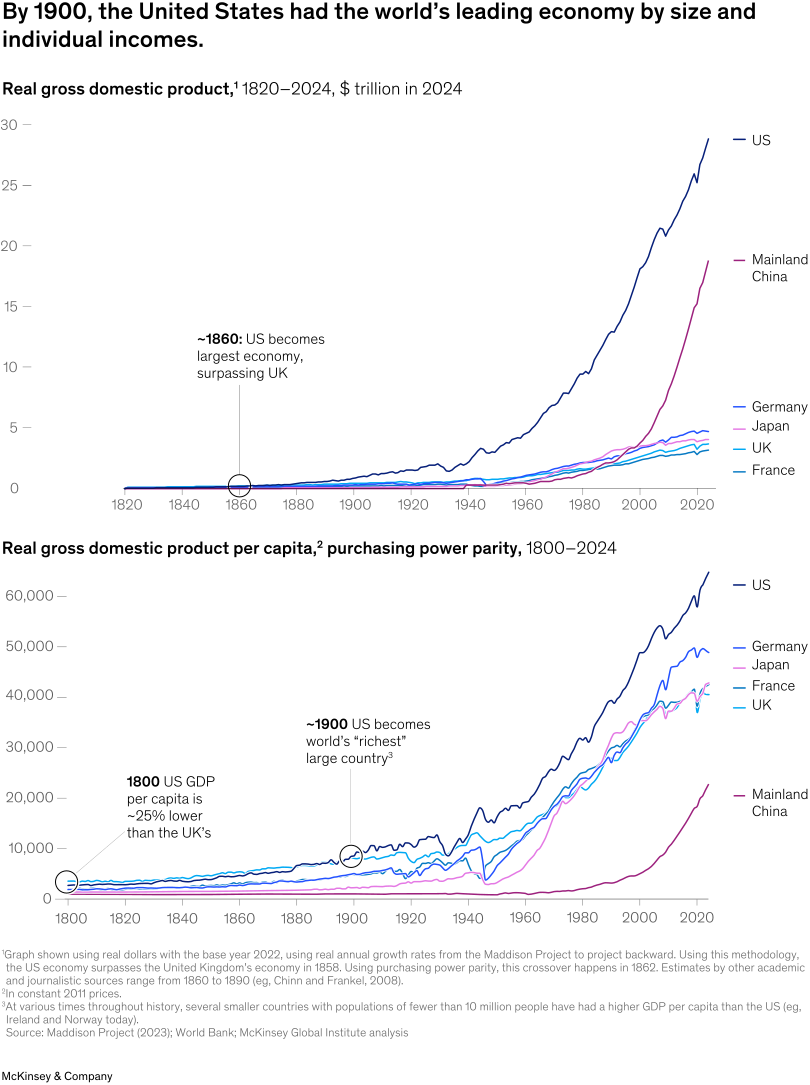
Two line charts track long-run economic leadership. Real GDP (1820–2022) shows the US overtaking the UK around the mid‑1800s and expanding far beyond other large economies in the 20th century, with China rising rapidly in recent decades. GDP per capita (PPP, 1800–2022) shows the US moving from below the UK in 1800 to becoming the richest large country around 1900 and remaining at the top thereafter. Overall takeaway: US economic leadership has deep historical roots, even as global competition has intensified recently.
The combination of leadership in global markets, powerful innovation ecosystems, and individual economic opportunity and prosperity can be summed up in one phrase: economic competitiveness (see sidebar ”Defining—and measuring—competitiveness”).
Today, the United States has 4 percent of the global population but generates 26 percent of GDP, and it accounts for more than 50 percent of market capitalization (Exhibit 2). It has exceeded many of its rich-country peers in labor productivity and growth, especially in recent years, when productivity has accelerated at levels unseen in other major economies. Leadership in technology also continues to underpin US competitiveness: The country is home to a plurality of the world’s top-cited scientists and has the most notable AI models. Announced annual inflows of greenfield foreign direct investment (FDI) have roughly doubled from the pre-pandemic period.4 And today, as it has since roughly 1900, GDP per capita exceeds that of other major economies.
Exhibit 2
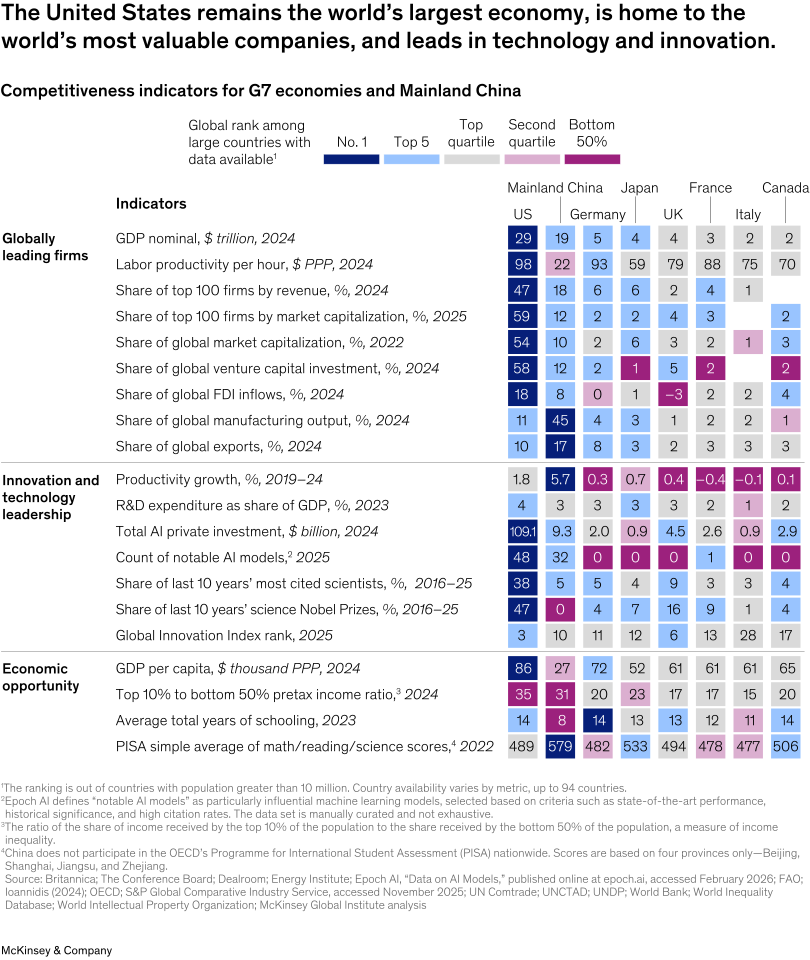
A heatmap table compares competitiveness indicators across the US, G7 peers, and Mainland China. The US ranks at or near the top on measures tied to globally leading firms and innovation—such as GDP size, labor productivity, shares of the top 100 firms, venture capital, notable AI models, and highly cited scientists. Mainland China stands out on manufacturing output and exports, while household outcomes (for example, GDP per capita, inequality, and education measures) are more mixed across countries. The main message: US strengths are concentrated in high-value firms and innovation, but manufacturing/trade leadership and broad household outcomes are not uniformly dominant.
These are cause for celebration. But there are also reasons for reflection. The United States is no longer the global leader in manufacturing and trade. Its lead on technology is narrowing amid greater competition with China.5 And the picture of household well-being is mixed: Although aggregate measures show high levels of income, many households feel they can no longer keep up economically, contributing to low levels of public trust.6
Here we examine the hallmarks of economic competitiveness: globally leading firms, leadership in technology and innovation, and economic opportunity.
US firms lead global markets
American companies make up more than half of the top 100 firms globally by market capitalization and revenue (Exhibit 3). From start-ups to large corporations, they attract an outsize share of capital from global markets. US firms hold more than half of global public equity funding and receive more than 50 percent of global venture capital (VC) investment. These valuations are supported, at least in part, by the fact that US firms have the highest levels of productivity and rates of productivity growth among firms in G20 economies. Large US firms excel on a range of other corporate performance metrics; compared to European peers, they have 30 percent higher returns on invested capital and 50 percent faster top-line growth.
Exhibit 3
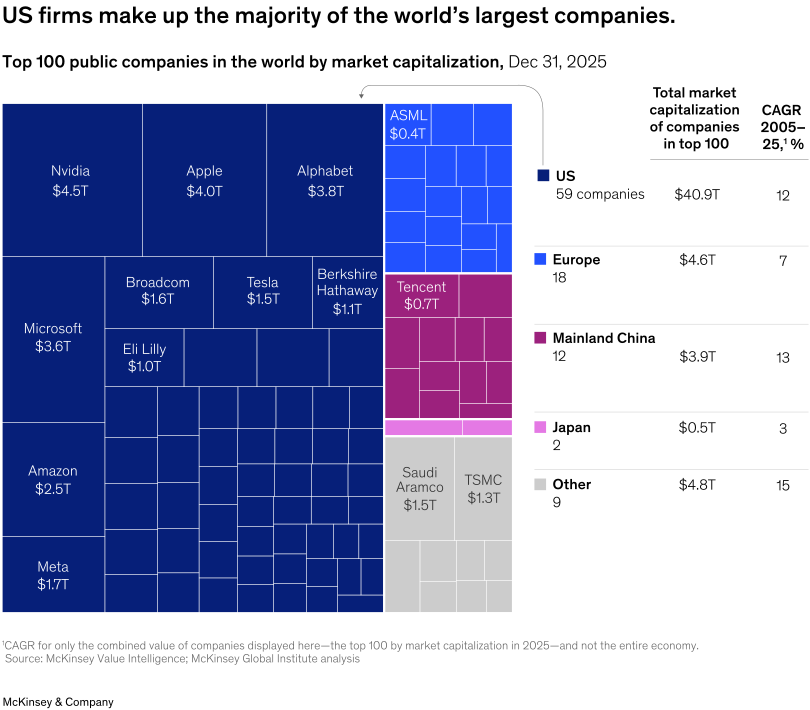
A treemap shows the top 100 public companies by market capitalization (Dec 31, 2025), with box size proportional to company value and colors grouped by region. The United States accounts for 59 of the 100 companies and the vast majority of total market value (about $40.9T), with many of the largest boxes belonging to US tech and tech‑adjacent leaders (for example NVIDIA, Apple, Microsoft, Alphabet, Amazon). Europe and Mainland China have far fewer firms and much smaller combined market capitalization. Takeaway: global equity value among the very largest firms is highly concentrated in US companies.
To be sure, a sizable share of US market capitalization is connected to the technology sector. Yet US firms lead across a range of sectors and are present in the upper echelons of all of them.
US market leadership is not a recent development: The United States has been the preeminent home to the world’s top companies for more than a century, even as these companies have themselves turned over (Exhibit 4). Over the past 25 years, for example, only Microsoft has remained in the top ten global firms by market capitalization. The sectoral composition has also shifted, from industrials and energy through the 1980s to almost entirely technology today.
Exhibit 4
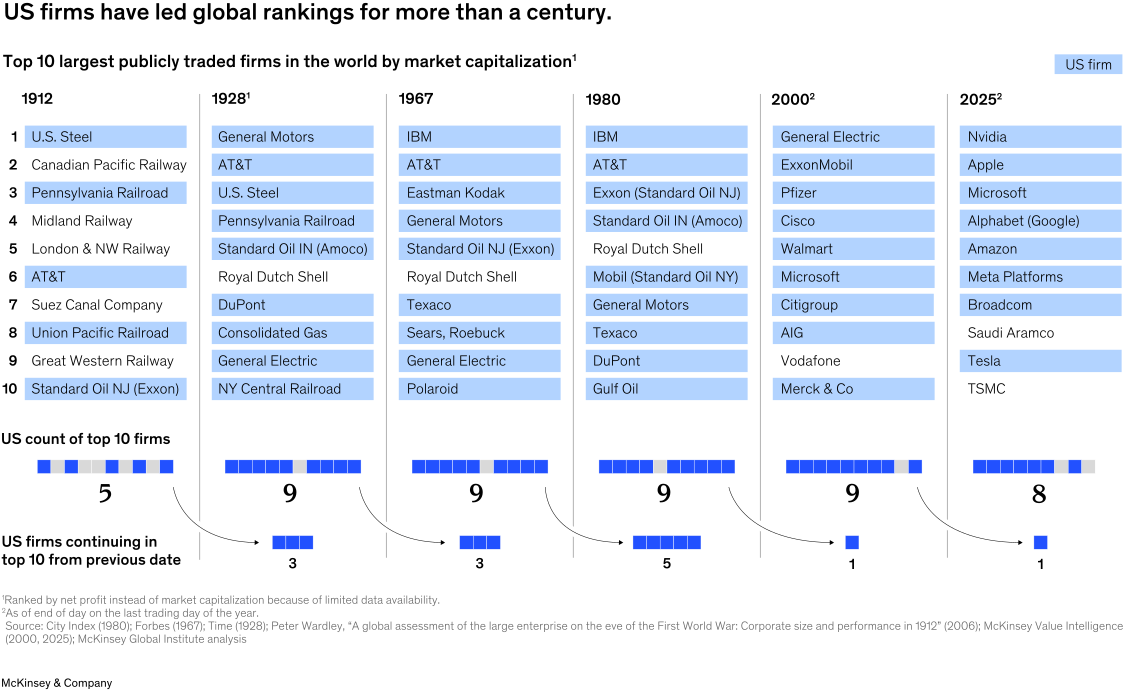
A timeline table lists the top 10 publicly traded firms by market capitalization at selected points (1912, 1928, 1967, 1980, 2000, and 2025). Across all snapshots, US firms occupy most of the top 10 (typically 8–9, and 8 in 2025), even as the leading sectors shift from rail and steel to autos and oil, then to modern technology. A small indicator shows that the specific firms change significantly between periods, implying high turnover within a persistent US lead. Takeaway: US corporate dominance has been durable across eras despite frequent reshuffling of individual champions.
Fundamentally, US firms’ outperformance is rooted in greater dynamism: They exhibit higher rates of labor reallocation, market entry and exit, and growth of young firms. That dynamism translates to higher national productivity growth (Exhibit 5).
Exhibit 5
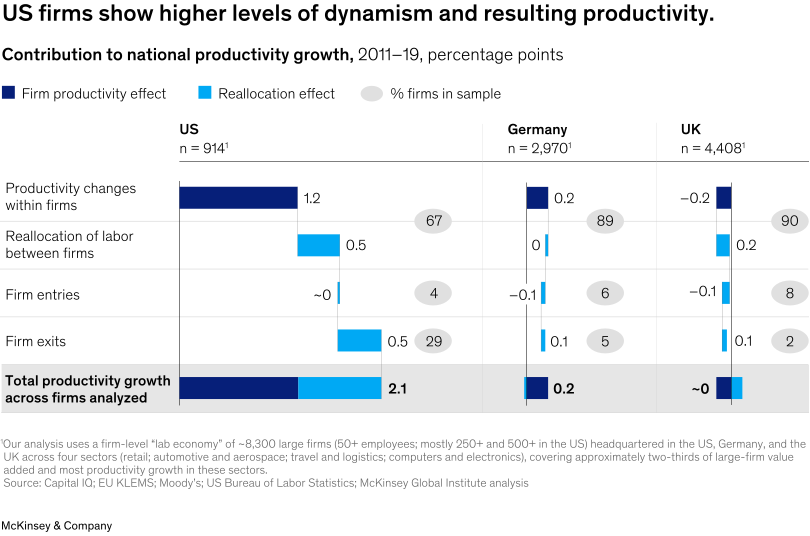
A waterfall chart compares contributions to productivity growth across large-firm samples in the United States, Germany, and the United Kingdom (2011–19). The US shows much higher total productivity growth (about 2.1 percentage points) than Germany (~0.2) and the UK (~0), driven by larger within‑firm improvements and stronger reallocation/exit effects (resources shifting to more productive firms and weaker firms exiting). Germany and the UK show smaller positive contributions and, in places, offsets. Main takeaway: greater business dynamism and reallocation in the US translate into faster productivity growth.
US manufacturing leadership has receded
Notably, one major sector in which the United States no longer has a leading global market share is manufacturing. China began expanding its industrial capacity in the 1980s, then ramped it up on a large scale in the 2000s, surpassing the United States in share of global manufacturing output in 2010. Today, China produces nearly half of global manufacturing output, compared to 11 percent for the United States.
US manufacturing has also lost ground domestically as the economy has shifted toward services. Over the past 50 years, manufacturing’s share of both GDP and employment has declined from more than 20 percent to less than 10 percent today. This halving of manufacturing employment is equal to about 19 million jobs today. These were mostly middle-class jobs, and they have been offset by growth in high-skill jobs in the knowledge economy—for example, in technology, software and finance—along with lower-skill services jobs, such as home cleaning. Between 2000 and 2018, for example, the share of all US jobs with wages in the middle of the income distribution fell six percentage points.
The shift to services has had additional economic implications. For one, as the United States began to import the goods it consumed, it tilted from a trade surplus to a trade deficit. Before 1976, the United States was a net exporter; it then became a net importer, with a trade deficit hovering around 3 percent of GDP over the past decade. And over time, the United States has lost some of its capacity to produce a wide range of products—from sports shoes to smartphones, dysprosium to data processors, ships to chips—presenting questions about future resiliency. Of course, some of these products matter more for national security and future economic competitiveness than others. Today, 40 percent of US imports, worth more than $1 trillion, are considered critical, or “central to resilient, diverse, and secure supply chains to ensure economic prosperity and national security.”
Nevertheless, the United States remains the second-largest manufacturer and trading partner for the world, accounting for 10 percent of the world's total exports. With an output of $7.3 trillion, including in many of the same products or categories where it imports large volumes, and a workforce of almost 13 million, the United States retains a strong manufacturing base on which it might build capacity in industries that will become increasingly important in the future, including semiconductors, electrification, and next-era hardware such as robotics and autonomous systems.
New manufacturing capacity is more than just factories. Also needed are an educated and skilled workforce that can fill shortages in fields such as engineering; a strong national balance sheet to support the needed financing; and restored investment in infrastructure, especially for energy.
US leadership in innovation and tech continues as new pressures emerge
Continued high valuations hinge on whether recent accelerations of productivity will indeed translate to higher economic (and earnings) growth over the long term. Higher productivity growth rates, especially in recent years, have been accompanied by higher rates of business investment and R&D spending, a positive sign for long-term growth potential. The United States leads the world on R&D spending in absolute terms, and, among major economies, as a share of GDP. Large US firms (those with at least $1 billion in annual revenue) have expanded their investment and R&D spending more rapidly than peers in other major economies. Compared to European peers, for example, they have 60 percent greater investment and 80 percent greater R&D intensity, and they have increased their investment and R&D at more than triple the European rate (Exhibit 6). Big tech firms drive much of this disparity.
Exhibit 6
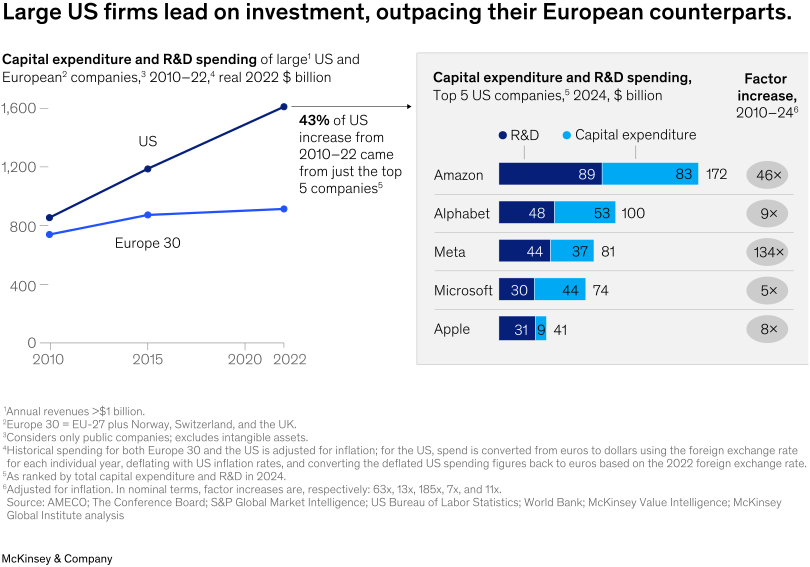
Two charts compare business investment and R&D. A line chart (2010–2022) shows combined capital expenditure and R&D spending rising faster for large US companies than for large European peers, widening the gap over time; an annotation notes that a large share of the US increase is driven by the top five companies. A bar chart details 2024 spending for the top five US firms (Amazon, Alphabet, Meta, Microsoft, Apple), splitting R&D and capex and showing very large multipliers since 2010 for several firms. Takeaway: the US investment/R&D advantage is expanding, largely propelled by scale and spending in big tech.
Private-sector investment in frontier technologies exceeded $1 trillion between 2021 and 2024, complemented by more than $50 billion in federal R&D funding. The return on investment is striking: America has outperformed in intellectual property and critical technologies. The World Intellectual Property Organization ranks the United States near the top of its Global Innovation Index. And compared with other major economies, the United States has more than a tenfold lead in private investment in AI. Today, the nation leads the world in the number of notable AI models, accounting for more than half of the world’s total.
Another effect: Flourishing US knowledge ecosystems of universities and venture capital–backed start-ups attract and develop many of the greatest minds from all over the world, paving the way for ongoing success in science and technology. Today, nearly 40 percent of the world’s leading scientists, or those in the top 200,000 globally by citations, are based in the United States; no other country has more than 10 percent. Half of the scientific Nobel Prize winners over the past decade call America home.
Competition in critical technologies is heating up
Past success does not guarantee future results, of course, and the US lead in technology is narrowing as China becomes more competitive. Some are now warning of a second “China shock,” should China displace American leadership in critical technologies.
Beyond simply focusing on the gaps of the past, the United States needs to prepare for leadership in the industries that will be most important in the coming decades. Future competitiveness increasingly hinges on leadership in critical technologies, such as AI, robotics, biotechnology, quantum computing, high-performance batteries, and space-based technology.
Economically, these technologies promise great gains for profits and wages. Geopolitically, they will be critical for protecting national security; their dual-use (military and civilian) nature means firms that develop them will be on both frontiers. In all these areas, China has made rapid progress and, in some cases, has taken the lead.
In remarkably short order, China has moved from producing low-cost goods to leading the world in complex, capital-intensive industries such as electric vehicles and photovoltaics. This shift is now extending beyond manufacturing into research-intensive domains once dominated by advanced economies. In biotechnology, for example, China’s output in drug discovery has grown more than tenfold since 2013. As of 2024, China surpassed the United States in the number of clinical trials and in the count of clinical-stage molecules. Altogether, China’s life sciences industry is no longer confined to generic biologics or follow-on products, and it is now playing a leading role in generating sophisticated novel biologics.
In the domain of AI, while America still has the most sophisticated AI models, China has more robots than the rest of the world combined. The United States has approached AI as a product unto itself, focusing on screen-based text and images. China’s approach, however, has emphasized AI’s deployment in the physical world, with intelligent machines that can see, decide, and act in real time. For example, Chinese firms are integrating AI into industrial robots that learn from their environments, drones that analyze visual data onboard while in flight, and autonomous vehicles whose core intelligence runs directly inside the vehicle rather than in the cloud.
Recently, China has also established a strong presence in the realm of fundamental scientific research, advancing the frontiers of knowledge. From 2017 to 2023, China overtook the United States in most cited research in fields including machine learning, quantum sensors, advanced integrated circuit design and fabrication, adversarial AI, natural language processing, and high-performance computing (it already led in other fields, including electric batteries and advanced magnets). In some instances, China is deploying this research in practical uses with tangible output; for example, China developed the world’s first quantum satellite. Although most cities with dense populations of highly cited researchers are American, Beijing saw the largest absolute inflow from 2019 to 2023.
To lead in critical technologies in the decades to come, the United States will need not only to establish an edge in today’s emerging technologies but also to make the discoveries that uncover tomorrow’s. The nation will need to support innovation ecosystems and continue to attract—and build—talent. Currently, the United States graduates fewer engineers than China, both in absolute terms and relative to population size. Even more fundamentally, in K-12 education, the United States lags behind both its own historical record and other major economies. The 2024 National Assessment of Educational Progress showed a downward trajectory in math, science, and reading; only about a third of eighth-grade students were proficient. The Programme for International Student Assessment found that American 15-year-olds score lower on average in math than their peers in all other G7 economies. A robust public education system rooted in general knowledge and problem solving has been a historical strength of the United States. The question today is how to restore that advantage.
Average incomes are high, but prosperity is uneven
Beyond scale of firms and leadership in technology, a final component of competitiveness is economic opportunity, or the extent to which growth translates to household prosperity in the form of higher incomes. Economic opportunity drives a virtuous cycle with innovation, as the potential for high incomes (and access to resources, such as start-up capital) attracts and retains top talent. Higher broad-based wages fuel thriving consumer markets, a longtime driver of American growth. More broadly, when individuals have higher living standards, they tend to be more productive, fostering further growth.
Today, the United States remains a place of immense economic upside, producing high average incomes; no other country of ten million or more people has a higher GDP per capita (even in purchasing power parity terms). The story is particularly pronounced for Americans in high-income brackets: The paychecks of the top decile of American earners are 10 to 50 percent higher than those of peers in major European economies and Canada. Perhaps less well known, Americans in the top 40 percent of income earn more than their counterparts in major European economies, and the top 20 percent earn more than their peers in Canada.
The story changes for the bottom half of the income distribution, with American incomes lagging behind those of major European economies and Canada (Exhibit 7). The bottom quintile of American incomes has been gaining ground recently, but the gap remains wide. Among major economies, the United States has one of the widest gaps in income levels between the top 10 percent and bottom 50 percent.
Exhibit 7
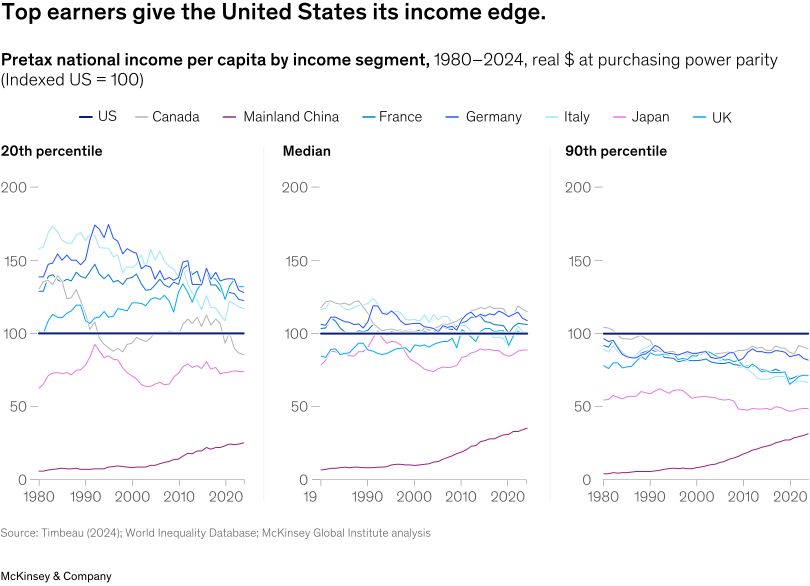
Three line charts compare pre‑tax national income per capita across countries at the 20th percentile, the median, and the 90th percentile (1980–2024), indexed so the US equals 100. At the 20th percentile, several peer countries sit above the US, suggesting stronger lower‑income outcomes elsewhere; at the median, many peers track closer to the US. At the 90th percentile, the US stands out above peers, with other advanced economies below 100. Takeaway: the US income advantage is strongest at the top of the distribution rather than broad‑based across all income groups.
This gap in income levels has grown over the past 50 years. Although all income segments have seen real growth, market incomes (wages and asset flows) have grown the most for the top two quintiles. For the bottom 60 percent of the population, more income growth has come in the form of government benefits than from wages, and the middle quintile has seen the lowest overall growth.
This disparity in wage growth has many well-researched causes. For example, as discussed, technological change and deindustrialization have reduced the availability of middle-wage jobs while expanding demand for both highly educated and low-wage workers. High returns from financial assets, meanwhile, have produced very high levels of wealth for high-income households, which tend to own more assets: The top 1 percent of wealth holders have more than $16 million in wealth per capita and collectively own 5 percent of global wealth. Others include insufficient human-capital development for many American workers and pressures from expanding global trade.
Sustained disparities in real wage growth and levels, wealth accumulation, and intergenerational income mobility have contributed to a growing sense among more Americans that they will not be able to reach their economic goals. As this sentiment takes hold, it raises the question of whether Americans’ support for public policies that promote innovation and dynamism will continue.
Structural shifts, including the movement from a manufacturing-based to a services-based economy, have also led to a growing geographic dispersion of productivity levels, seen strikingly across major US cities (Exhibit 8). Over the past several decades, some have seen relatively modest productivity growth, including those in the historical Rust Belt. On the other end of the spectrum, cities with deep knowledge ecosystems have seen extraordinary gains and continue to offer high income possibilities. For example, in San Jose, California, GDP per capita has more than tripled since 2000 (see sidebar “What makes some cities more productive than others?”). Notably, however, the cost of living also varies by city; housing in particular tends to be more expensive in cities with higher levels of productivity and income.
Exhibit 8

A dot-and-line chart shows real value added per employee for the 40 largest US metropolitan areas in 1995, 2019, and 2024. The average across MSAs increases only modestly, but the top metros (such as San Jose, San Francisco, and Seattle) move far to the right by 2024, indicating large productivity gains. Many other metros cluster closer together, creating a longer “tail” and greater dispersion. Takeaway: productivity growth has become increasingly concentrated in a small set of superstar cities, widening the gap with the rest.
The United States remains the most competitive economy in the world on a multitude of fronts. Getting to this point has not been a straight path. There were twists and turns, transformations and reinventions. Before contemplating the future, we first turn to what can be learned from the past 250 years, telling the story of four chapters of US competitiveness.
AI won’t fix bad data. Hoteliers say the foundation comes first: roundtable

https://hotelsmag.com/news/ai-wont-fix-bad-data-hoteliers-say-the-foundation-comes-first-webinar/
Artificial intelligence may dominate hospitality technology conversations today, but hotel executives say the industry’s biggest challenge is far less glamorous: getting its data in order.
During a roundtable discussion—” How Data Powers the Future of Hotel Operations”—hosted by HOTELS Magazine and in partnership with Otelier, hotel operators, technology providers and brand representatives agreed that AI has enormous potential to improve hotel profitability, from revenue management and labor scheduling to food-and-beverage operations and asset planning. Yet, they repeatedly stressed that AI is only as effective as the quality and accessibility of the data behind it.
“We’ve probably got more data now than we’ve ever had,” said Nick Clark, SVP of operations, Remington Hospitality. The challenge, however, is no longer collecting information but distilling it into meaningful insights that operators can actually use to make decisions.
That sentiment set the tone for a discussion centered less on AI hype than on the practical work required before hotels can truly benefit from it. (The full video is embedded below.)
Data Before AI
Several panelists cautioned that many hospitality companies are eager to deploy AI before establishing reliable data foundations.
“I think AI is only as good as the data,” said Matthew Bright, SVP, head of IT, Davidson Hospitality Group, who argued that operators must first understand how their information is collected, maintained and governed before expecting artificial intelligence to generate meaningful insights. Simply layering AI on top of poor-quality data, the panel agreed, will not produce better business decisions.
Instead, executives see AI’s immediate value in making existing information more accessible by filtering through enormous volumes of operational data and highlighting patterns that would otherwise remain hidden.
Clark noted that AI can combine guest reviews, service calls, maintenance issues and operational records to uncover relationships that individual departments might never identify on their own. Rather than replacing human judgment, the technology becomes a decision-support tool capable of surfacing previously overlooked insights.
Fragmented Systems: The Obstacle
Before hotels can fully capitalize on AI, panelists said they must address another persistent problem: disconnected technology systems.
Many properties continue operating with legacy property-management systems, separate departmental software and isolated databases that were never designed to communicate with one another. As a result, valuable information often remains trapped inside organizational silos.
According to Clark, technology providers increasingly find themselves extracting information from virtually any source available—from modern APIs to PDFs and text files—simply to build usable datasets. While newer systems are improving connectivity, the panel acknowledged that the industry’s fragmented technology ecosystem remains a major barrier to progress.
The discussion also highlighted uncertainty over who should ultimately lead digital transformation. While brands establish technology standards, owners typically fund investments, management companies operate the assets and software vendors develop the platforms, creating shared responsibility without a clear owner.
AI Next
Where executives do see near-term opportunity is operational optimization.
Revenue management emerged as one of the clearest use cases. Rather than manually evaluating pricing decisions every day, operators expect AI to monitor demand patterns, recommend pricing strategies and identify trends that human analysts may overlook, while revenue leaders continue overseeing broader commercial strategy.
Labor management represents another promising application. Panelists envisioned AI improving staffing forecasts by incorporating not only reservations but also demand signals that indicate future booking behavior before reservations materialize.
Beyond staffing, executives discussed how usage data from guestroom key systems could influence future hotel design by revealing how travelers actually use amenities such as fitness centers, lounges and public spaces. Those insights could eventually shape everything from building layouts to housekeeping schedules and facility investments.
The ‘Secret Sauce’
One of the discussion’s more candid moments centered on loyalty programs.
Panelists argued that hotel brands possess enormous amounts of guest data through their loyalty ecosystems, giving them a competitive advantage that independent operators and third-party management companies cannot easily access.
Several executives suggested that AI-powered personalization could dramatically improve guest experiences, but only if operators gain greater access to the behavioral information currently held within brand loyalty programs. Until then, that data remains one of the industry’s most closely guarded competitive assets.
F&B a Data Business
The conversation also highlighted how analytics is reshaping hotel food-and-beverage operations.
Rather than relying on intuition, operators increasingly use transaction-level data to optimize menus, purchasing decisions, kitchen workflows and labor deployment. One executive described using AI to benchmark procurement across multiple hotels by analyzing invoices and identifying purchasing inconsistencies, while another discussed integrating point-of-sale, kitchen display and inventory systems to improve menu engineering and reduce waste.
Executives also pointed to detailed restaurant analytics—including server performance, menu-item sales and guest purchasing behavior—as evidence that hospitality is becoming increasingly data-driven beyond guestrooms alone.
The opportunity ahead
Although enthusiasm surrounding AI remains high, the panel repeatedly returned to a common conclusion: the technology itself is no silver bullet.
For hotels, the greatest opportunity lies not in replacing people with artificial intelligence but in creating connected data environments that allow operators to make faster, more informed decisions. AI may ultimately transform hospitality, participants agreed, but only after the industry solves a challenge it has been discussing for more than a decade: making its data accessible, accurate and actionable.
Most Visitors Miss This Side of Philadelphia — And It’s the City’s Most Important Story

Christian Carollo/Shutterstock
https://www.fodors.com/world/north-america/usa/pennsylvania/philadelphia/experiences/news/the-best-black-history-tour-of-philadelphia
A Black history walking tour in Philadelphia reveals the stories, landmarks, and hidden truths often left out of America's founding narrative.
Philadelphia will always be front and center when it comes to our nation’s history (they don’t call it the “Birthplace of America” for nothing), and with the country celebrating its semiquincentennial, there’s never been a better time to visit. Yes, major events like the signing of the Declaration of Independence in 1776 took place here, but Philadelphia also has an incredibly rich Black heritage—and one of the best ways to learn more about it is by taking a historical walking tour.
The Original Black History Tour is one of several guided walks offered by The Black Journey, a Black-owned company founded in 2019 by Raina Yancey, a Philadelphia-born lawyer whose mother was a ranger at Independence National Historical Park. The lead guide, Mijuel K. Johnson, is a native Philadelphian who holds a degree in history and political science from La Salle University. In addition to scholarly knowledge, Johnson is known for his passion, humor, and engaging storytelling. Each tour typically lasts around two hours and takes place primarily in Old City and the surrounding neighborhoods.
One of the stops on this tour—the company’s flagship offering—is Mother Bethel AME Church. It’s located in Society Hill, which was the epicenter of Black culture when it was once part of the 7th Ward. This church, founded by Rev. Richard Allen in 1794, sits on the oldest parcel of continuously Black-owned land not only in Philadelphia but in the United States. Today, it’s a National Historic Landmark, and Allen, who died in 1831, is buried in the church’s basement crypt.

The Black Journey Walking Tour©Visit Philadelphia
A few blocks away is Washington Square, formerly known as Congo Square. In the 18th century, it was a popular gathering spot for both free and enslaved people. It also served as a place to celebrate the traditions of their homelands during festivals (vendors would often sell food like pepper pot stew, a mix of meat and vegetables in a spicy pepper sauce). A portion of the park was also used as a potter’s field for free and enslaved Blacks, as well as those who perished in the 1793 yellow fever epidemic.
Steps from the square is Independence Hall, where the country’s most important founding documents were debated and signed, but what many may not know is that on the second floor of the building (called the Pennsylvania State House in colonial times) was a courtroom where recaptured enslaved people were put on trial. In 1850, the Fugitive Slave Act was passed (an amended and more aggressive form of the 1793 law), which allowed for enslaved people who had crossed state lines to be brought back to face trial. The majority of the cases resulted in escapees being sent back to enslavement.
The tour also includes a visit to Independence Mall, the four-block plaza that’s home to The Liberty Bell. You’ll learn about prominent Black Philadelphians such as James Forten, born a free citizen in 1766 and who was a wealthy sail maker, Revolutionary War veteran, and one of the leaders of the free Black community.

Johnson House Historic Site Photo by R. Kennedy for Visit Philadelphia®
The walk concludes on the mall at the President’s House (foundations from what was once George Washington’s home during his presidency). Illustrated panels of an open-air slavery exhibit tell the story of one of Washington’s slaves, Ona Judge (a maid to Martha Washington brought from Mount Vernon), who escaped in the 1790s and made it to freedom in New Hampshire. (Note: After many of the panels were removed due to an executive order, the city sued the federal government to get them reinstated. On June 18, 2026, an appeals court ruled that the city lacks authority to control exhibits at the site. It’s unclear if the city will pursue further legal options.)
The Black Journey’s tour offers a fascinating glimpse into the myriad contributions of Black people before, during, and after our nation’s founding. For more Black history, take a half-day trip to Germantown, 20 minutes from Old City (Uber’s your best bet to get there and back). In addition to a Revolutionary War battle fought here in 1777, there’s fascinating history to be found at the Johnson House Historic Site, a stop on the Underground Railroad (it was owned by the Johnson family, anti-slavery Quakers). Abolitionist William Still attended meetings here, and it’s believed Harriet Tubman did as well. During tours, guides point out the third-floor attic where escaped slaves hid from federal marshals.
A few blocks away is the Germantown Mennonite Meetinghouse, the site of the first written anti-slavery petition in the New World in 1688, and across the street is Wyck, a historic Quaker home with one of the country’s oldest rose gardens—the perfect (and fragrant) way to cap off a visit here before heading back to Philly.

Independence Hall in Philadelphia, Pennsylvania USAF11photo/Shutterstock
Where to Stay
Overlooking Logan Circle’s Swann Memorial Fountain, The Logan Philadelphia Hotel is a stylish 391-room property. Amenities include a café serving La Colombe coffee and the Assembly Rooftop bar with sweeping views (especially scenic at sunset) of the skyline and the Philadelphia Museum of Art at the end of Benjamin Franklin Parkway.
Spend a night in New Hope, an artsy Bucks County town less than an hour’s drive. After a stroll on Main Street, lined with galleries and shops, dine al fresco in the charming courtyard at Zoubi. Stay at the trendy, centrally located 38-room Login Inn. For history buffs, it’s a quick drive to Washington Crossing, where Washington famously crossed the Delaware River on December 25, 1776.
Where to Eat
For a one-of-a-kind culinary experience, book a table at Elwood, an intimate BYOB spot in Fishtown. The cuisine, courtesy of chef Adam Diltz, features modern takes on colonial-era dishes such as pepper pot soup, turtle soup, catfish and cornmeal waffles, and chicken fricassee with an heirloom bean salad (be sure to try the delicious cornbread with apple butter).
The Red Owl Tavern at the Kimpton Hotel Monaco, directly across from Independence Hall, is an ideal lunch or dinner spot. The two-story space has a fun vibe and an eclectic menu. Appetizers include smoked pork belly and fried mushrooms, while the entrees range from arctic char to a classic burger.
Looking for a splurge-worthy meal? Vernick Fish from James Beard Award-winning chef Greg Vernick ticks all the boxes. The soaring space, with an open kitchen and top-notch service, is located within the Four Seasons hotel. Standouts include fresh oysters, yellowtail crudo, crispy octopus, and sea scallops in a beurre blanc sauce.

The President’s HousePhoto by M. Kennedy for VISIT PHILADELPHIA®
While You’re in Town
On view until the end of 2026, the Museum of the American Revolution‘s The Declaration’s Journey exhibit chronicles the Declaration of Independence’s history and legacy (it’s said to have inspired over 100 independence movements worldwide). The museum also tells Black stories, including those of William Lee, Washington’s enslaved valet, and Phillis Wheatley, America’s first published female Black poet.
The Penn Museum on the University of Pennsylvania’s campus focuses on anthropology and archaeology. Check out the recently opened Native North American Gallery, created in partnership with eight Indigenous consulting curators. The 2,000-square-foot space has more than 250 artifacts culled from the museum’s outstanding collections, including weapons, tools, woven items, and intricate beadwork.
DUHC&S | Strategic Hospitality Consulting & Advisory
We transform hospitality and tourism businesses through strategic solutions, operational efficiency, and comprehensive renovation. With over 40 years of experience working with brands like Hilton, Hyatt, Sheraton, and Sonesta, we enhance asset value and profitability through:
*Operational excellence and brand standards (GSI +90%)
*Market penetration and commercial strategies
*Key partnerships and disruptive innovation
*Hotel openings and repositioning
Proven results :
✅ 48% GOP |
✅ +120% asset valuation growth
✅ Successful projects across 6 Latin American countries
🔹 Let's connect :
📩 Email: diurugeles@gmail.com
📱 WhatsApp: +57 3153259968
"To read the full analysis on our blog and contact us, please check the link in the first comment. 👇"
https://viajes-noticias-duhospitality.blogspot.com
https://viajes-duhospitality.blogspot.com
https://travel-duhospitality.blogspot.com
Instagram: https://www.instagram.com/diur_2000/
Disclaimer
DUHC&S shares this information for educational and informational purposes only. The news articles reproduced here are sourced from public and recognized media outlets. We are not the original authors of this content but rather its distributors. All credits go to the original sources cited in each article. If you are the legitimate owner of any material and wish to have it modified or removed, please contact us immediately at diurugeles@gmail.com, and we will address your request promptly.


Comments
Post a Comment